BALTIMORE (Stockpickr) -- Trick or treat? Mr. Market has been dishing out the latter for any investors who come knocking this Halloween -- and that's not likely to change as we enter the final stretch of 2013.
Historically, the final months of the year come with the strongest gains for investors. That's quite a statement considering the fact that the S&P 500 is already up 23.6% since the calendar flipped over to January. But as I'll show you in a moment, stocks aren't showing any red flags right now; in fact, the macro view is about as bullish as it gets.
In spite of the S&P's ratchet moves higher this year, there are still some key buying opportunities in the big-name stocks. That why, today, we're taking a closer technical look at five of them.
If you're new to technical analysis, here's the executive summary.
Technicals are a study of the market itself. Since the market is ultimately the only mechanism that determines a stock's price, technical analysis is a valuable tool even in the roughest of trading conditions. Technical charts are used every day by proprietary trading floors, Wall Street's biggest financial firms, and individual investors to get an edge on the market. And research shows that skilled technical traders can bank gains as much as 90% of the time.
Every week, I take an in-depth look at big names that are telling important technical stories. Here's this week's look at five high-volume stocks to trade this week.
SPDR S&P 500 ETF
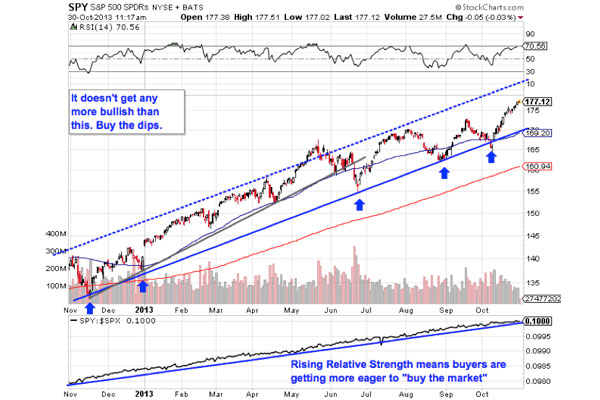
It makes sense to start off with a look at the broad market. To do that, we'll look at the SPDR S&P 500 ETF (SPY), the most investible way to buy "stocks" as a group. Frankly, charts don't get much more bullish than SPY has been for the last 12 months. We're very much in a "buy the dips market" right now.
The S&P 500 index has been in a textbook uptrend since last November, bouncing higher within a well-defined price channel. While the trend changed a bit back in late June, the setback was temporary, and the line connecting the price lows from those last 12 months has proven to be an optimal buying opportunity for the big index.
One thing worth noting is the fact that SPY's relative strength line has remained in an uptrend itself over the course of this rally. Since SPY is designed to track the S&P, an uptrend in relative strength indicates that investors are piling into the ETF more aggressively as a way to gain exposure to stocks. Considering the fact that this rally has largely lacked participation from retail investors, that's a pretty solid sign of strength.
If you're looking to pick up this ETF, I'd recommend waiting for it to pull back near the 50-day moving average.
Morgan Stanley
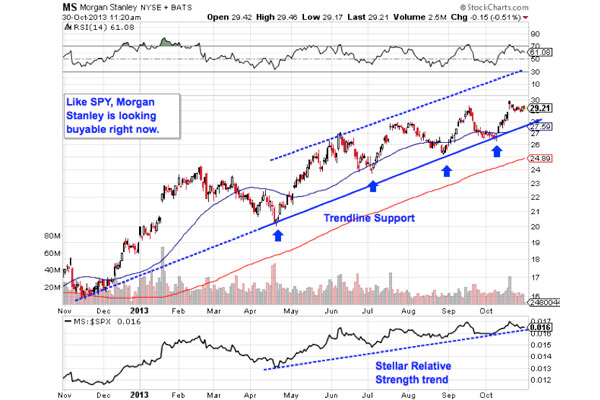
Financial services powerhouse Morgan Stanley (MS) is showing us the exact same setup right now, a fact that's not really that surprising considering the fact that the investment bank's big equity exposure basically makes it a leveraged bet on stocks.
But with markets in bull mode, that's a good thing!
Like SPY, Morgan Stanley is bouncing within a well-defined price channel right now. Price channels are valuable because they provide high probability ranges for a stock's price action. In other words, MS's price is unlikely to trade outside of those two bands on the chart above -- and that's exactly what makes this stock tradable right now. The best time to be a buyer comes on a bounce off of support, a level we're not far from.
Buying off a support bounce makes sense for two big reasons: it's the spot where shares have the furthest to move up before they hit resistance, and it's the spot where the risk is the least (because shares have the least room to move lower before you know you're wrong). Remember, all trend lines do eventually break, but by actually waiting for the bounce to happen first, you're ensuring the MS can actually still catch a bid along that line.
A stellar relative strength uptrend in MS adds some extra evidence that its rally has staying power.
Toyota
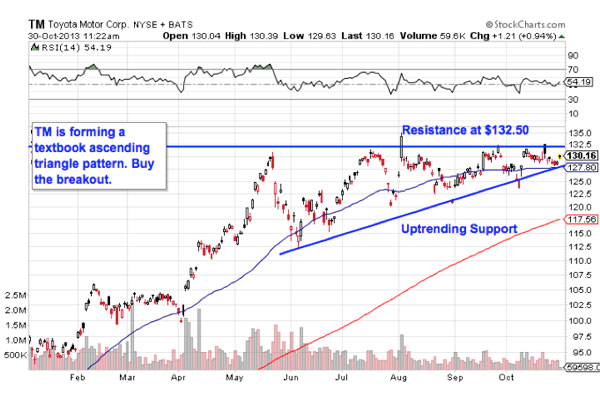
Japanese carmaker Toyota (TM) has basically spent most of its time tracking sideways in the second half of the year. But that doesn't mean that you should ignore TM as we reach the final stretch of 2013, especially as Japanese equities continue to outperform the market here at home. Toyota looks like it has some more upside ahead of it.
That's because TM is currently forming an ascending triangle pattern, a bullish setup that's formed by a horizontal resistance level above shares at $132.50 and uptrending support below shares' price action. As TM bounces in between those two technical price levels, it's getting squeezes closer and closer to a breakout just above that $132.50 level. When that happens, it's time to be a buyer.
It's going to be critical to wait for confirmation on a breakout in TM; after all, shares pushed above $132.50 temporarily back in early August, only to get swatted lower a day later. A close above that price ceiling followed by a consecutive open above it provides a higher-probability signal for traders.
Manulife Financial

Manulife Financial (MFC) is another stock that's forming an ascending triangle pattern right now. In the case of this $33 billion Canadian financial services firm, resistance comes into play at $18, a price level that's acted as a ceiling for shares since all the way back in July. The buy signal comes on a move through that $18 barrier.
Whenever you're looking at any technical price pattern, it's critical to think in terms of those buyers and sellers. Triangles, and other pattern names are a good quick way to explain what's going on in a stock, but they're not the reason it's tradable. Instead, it all comes down to supply and demand for shares.
That $18 resistance level is a price where there has been an excess of supply of shares; in other words, it's a place where sellers have been more eager to step in and take gains than buyers have been to buy. That's what makes a breakout above it so significant -- the move means that buyers are finally strong enough to absorb all of the excess supply above that price level.
After it happens, I'd recommend keeping a protective stop at $16.50.
Sherwin-Williams
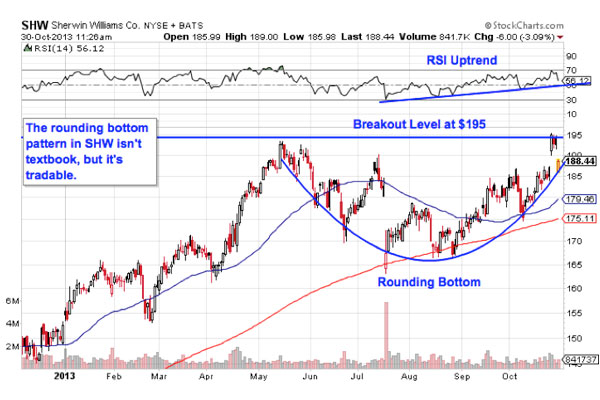
Last up is paint and coatings maker Sherwin-Williams (SHW). Sherwin-Williams has more or less kept pace with the S&P so far this year, rallying around 23% from the first trading session in January until today. But SHW looks primed to stage another leg higher in November; here's how to trade it.
SHW is currently forming a rounding bottom pattern, a price setup that indicates a gradual transition in control from sellers to buyers. The pattern's name is a pretty good description of how it looks on a chart -- the buy signal comes on a move through $195. Typically, rounding bottom patterns come at the bottom of a downtrend (not the top of an uptrend as we're seeing in SHW), but even though the setup here isn't textbook, the trading implications are exactly the same.
Follow Stockpickr on Twitter and become a fan on Facebook.
At the time of publication, author had no positions in stocks mentioned.
Jonas Elmerraji, CMT, is a senior market analyst at Agora Financial in Baltimore and a contributor to TheStreet. Before that, he managed a portfolio of stocks for an investment advisory returned 15% in 2008. He has been featured in Forbes , Investor's Business Daily, and on CNBC.com. Jonas holds a degree in financial economics from UMBC and the Chartered Market Technician designation.
Follow Jonas on Twitter @JonasElmerraji
No comments:
Post a Comment