 Richard Drew/AP NEW YORK -- The stock market started November on a strong note as investors reacted to an expansion in U.S. manufacturing last month. The improvement came during what could have been a difficult month for the U.S. economy, with a partial government shutdown that lasted 16 days and a narrowly averted default on the U.S. government's debt, which could have rattled financial markets. "With what happened in the last two months, it's amazing how strong this market has been," said Bob Doll, chief equity strategist at Nuveen Asset Management. The Institute for Supply Management reported that its manufacturing index increased to 56.4, the highest level since April 2011. That was better than the 55.1 figure economists were expecting, according financial data provider FactSet. The Dow Jones industrial average (^DJI) rose 69.80 points, or 0.5 percent, to 15,615.55. The Standard & Poor's 500 index (^GPSC) rose 5.10 points, or 0.3 percent, to 1,761.64. The Nasdaq composite (^IXIC) rose 2.34 points, or 0.1 percent, to 3,922.04. Energy stocks lagged the market after Chevron (CVX) reported that its third-quarter income fell 6 percent, missing analysts' estimates, due to weakness in the company's oil refining business. Chevron fell $1.95, or 1.6 percent, to $118.01. The energy sector was also weighed down by a drop in the price of oil. Crude oil fell $1.77, or 1.8 percent, to $94.61 a barrel. The positive start to this month's trading comes after a strong October for the stock market. The S&P 500 closed at a record high seven times during the month, most recently on Tuesday. It ended October with a gain of 4.5 percent. However, some investors have expressed skepticism that stocks can keep up this rapid pace pace heading into the last two months of the year. The S&P 500 is up 23 percent so far this year, while the average annual return on the S&P 500 is around 8 percent. Stocks are also starting to look expensive by some measures. Investors are paying more than $16 for every $1 of earnings in the S&P 500, the highest that ratio has been since February 2011. "I don't think this market is cheap by any means," said Brad McMillan, chief investment officer for Commonwealth Financial. "We've been urging caution for some time now." In the bond market, the yield on the 10-year Treasury note rose to 2.62 percent from 2.56 percent. On Friday morning, the Nasdaq's options market was halted due to a technical glitch. Regular stock trading was not affected. Among stocks making big moves: • The Container Store (TCS) more than doubled on its first day of trading on the New York Stock Exchange. The company raised $225 million in its initial public offering, pricing 12.5 million shares at $18 each. The stock soared $18.20 to $36.20. • First Solar (FSLR) jumped $8.83, or 18 percent, to $59.14. The solar panel maker said it had an adjusted profit of $2.28 per share for the third quarter, blowing past analysts' estimates of $1.13 per share, according FactSet. • Body Central (BODY) plunged 30 percent to $3.94 after the clothing and accessories retailer reported a third-quarter loss that was worse than analysts were expecting.
Saturday, November 2, 2013
Closing Bell: Stocks Start November on a Positive Note
Statoil to Export from Utsira - Analyst Blog
Friday, November 1, 2013
Who needs Twitter? Container Store doubles in IPO
 Container Store keeps employees happy NEW YORK (CNNMoney) The Container Store could barely contain the demand for its initial public offering.
 Shares of the retailer known for its clever home organization supplies doubled in their market debut Friday.
Demand appeared to be high before it started trading on the New York Stock Exchange.
The Container Store (TCS) priced its offering Thursday at $18 a share, the top end of its range.
The Container Store raised $225 million though the stock sale and plans to use those proceeds to pay dividends to its owners, including the private equity firm Leonard Green.
Growth is among the company's top priorities. According to CEO Kip Tindell, The Container Store, which currently has just 63 stores in the United States, can handily get to 300 stores. But the company hasn't specified a time frame for its expansion.
"It's great to be immature if you're a retail chain," Tindell told CNN. "There's a lot of runway left."
One concern for investors is that The Container Store hasn't turned a profit in the past three years. Its losses have slowed though. After reporting losses of $45 million and $30 million in the fiscal years 2011 and 2012, The Container Store lost just $130,000 in fiscal 2013, which ended in March.
The hot IPO market: The Container Store is the latest company to take advantage of this year's bull market.
IPOs in particular have been on fire. According to Renaissance Capital, companies that have gone public this year are up 50%.
Two other consumer companies have been among the hottest IPOs of 2013. Shares of sandwich shop Potbelly (PBPB) and organic food retailer Sprouts Farmers Market (SFM) more than doubled on their first day of tr! ading.
On Thursday, China e-commerce site 58.com (WUBA). which is often referred to as China's Craigslist, soared more than 40% in its first day of trading.
But the most eagerly anticipated IPO of the year will come next week. Social media site Twitter is set to debut on the NYSE. Investors are anxiously waiting to see whether it can keep the IPO momentum going.
CNN's Zain Asher contributed to this report. ![]()
Hulu Sale Called Off - Analyst Blog
Hulu is currently owned by News Corp. (NWSA), Walt Disney Co. (DIS) and Comcast Corp (CMCSA). Notably, Comcast acts as a silent partner following its acquisition of NBC Universal.
Hulu attracted bids from several potential bidders, which included big companies like DIRECTV (DTV), Time Warner Cable Inc. (TWC) and a joint bid from AT&T Inc. (T) and Chernin Group. While AT&T and DTV proposed a $1 billion dollar bid, Time Warner Cable wanted to become a stake holder in Hulu.
However, the bidders were restricted from owning the content rights for Hulu for more than two years. Network companies generally hike prices post the completion of the agreement.
The current owners have decided to retain ownership and inject $750 million for future growth. In spite of having no management control, Comcast will contribute an equal share of the $750 million investment.
The media houses have agreed that they will retain the subscription base model and will deliver content to enhance the customer's subscription value. However, postponing the sale still leaves the possibility of a stake sale.
Hulu received such high interest from potential bidders as growing saturation in the U.S. pay-TV market and increased competition from online video streaming service providers has sliced the traditional pay-TV operator's market share. Furthermore, Hulu boasts a strong subscriber base of more than 4 million and has generated $700 million revenues last year through advertising and monthly subscriptions.
Owners of Hulu wanted a buyer keen on investing in programming and maintaining its growth momentum. The media groups have confirmed that they themselves will spend on programm! ing, marketing, technology and expansion from the proposed $750 million investment.
Acquiring Hulu would have given the traditional pay-TV operators the leverage to negotiate better with the media companies. Nevertheless, Hulu's independent standing is favourable for the customers. We believe that stiff competition from this over-the-top (OTT) companies like Hulu may force the pay-TV operators to reduce their monthly fees to remain competitive.
Thursday, October 31, 2013
Top Growth Stocks To Watch For 2014
The PC market may be struggling, but the broader computing device market is doing just fine. When factoring in all form factors, Gartner now expects the total market to grow to 2.5 billion units by next year. That would be up from the 2.2 billion devices shipped last year, and the 2.35 billion units expected to get a move on in 2013.
Smartphones and tablets are easily driving all of that growth, as traditional PC form factors are expected to continue a downward trend. As one of the youngest form factors, tablets should put up the impressive growth and soar to 276 million next year. That's a subset of the market that effectively didn't exist at the beginning of 2010 until Apple (NASDAQ: AAPL ) jump-started the tablet renaissance with the iPad. Mobile computing has become incredibly important in both mature and emerging markets, according to Gartner's Carolina Milanesi.
The ultramobile category -- which includes devices like Google (NASDAQ: GOOG ) Chromebooks and Microsoft (NASDAQ: MSFT ) Windows 8 convertibles -- is starting to gain traction and may grab sales from premium tablets like the iPad. Windows 8.1 and Intel's�newest Bay Trail and Haswell processors will play a large role in this, particularly when considering the dramatic battery life improvements that Intel is delivering this year.
Top Growth Stocks To Watch For 2014: Thoratec Corporation(THOR)
Thoratec Corporation engages in the development, manufacture, and marketing of proprietary medical devices used for circulatory support. The company?s primary product lines include ventricular assist devices, such as HeartMate II, an implantable left ventricular assist device consisting of a rotary blood pump to provide intermediate and long-term mechanical circulatory support (MCS); and HeartMate XVE, an implantable and pulsatile left ventricular assist device for intermediate and longer-term MCS. Its ventricular assist devices also comprise Paracorporeal Ventricular Assist Device, an external pulsatile ventricular assist device, which provides left, right, and biventricular MCS approved for bridge-to-transplantation (BTT), including home discharge, and post-cardiotomy myocardial recovery; and Implantable Ventricular Assist Device, an implantable and pulsatile ventricular assist device designed to provide left, right, and biventricular MCS approved for BTT comprising hom e discharge, and post-cardiotomy myocardial recovery. The company also provides CentriMag, an extracorporeal full-flow acute surgical support platform that offers support up to 30 days for cardiac and respiratory failure. In addition, it offers PediMag and PediVAS extracorporeal full-flow acute surgical support platforms designed to provide acute surgical support to pediatric patients. The company sells its products through direct sales force in the United States, as well as through a network of distributors internationally. Thoratec Corporation was founded in 1976 and is headquartered in Pleasanton, California.
Advisors' Opinion:- [By Brian Pacampara]
What: Shares of medical device company Thoratec (NASDAQ: THOR ) sank 12% today after its quarterly results missed Wall Street expectations. �
Top Growth Stocks To Watch For 2014: Checkpoint Systms Inc.(CKP)
Checkpoint Systems, Inc. manufactures and markets identification, tracking, security, and merchandising solutions for the retail and apparel industry worldwide. The company operates in three segments: Shrink Management Solutions, Apparel Labeling Solutions, and Retail Merchandising Solutions. The Shrink Management Solutions segment provides shrink management and merchandise visibility solutions. It offers electronic article surveillance systems, such as EVOLVE, a suite of RF and RFID-enabled products that act as a deterrent to prevent merchandise theft in retail stores; and electronic article surveillance consumables, including EAS-RF and EAS-EM labels that work in combination with EAS systems to reduce merchandise theft in retail stores. This segment also provides keepers, spider wraps, bottle security, and hard tags, as well as Showsafe, a line alarm system for protecting display merchandise. In addition, it offers physical and electronic store monitoring solutions, incl uding fire alarms, intrusion alarms, and digital video recording systems for retail environments; and RFID tags and labels. The Apparel Labeling Solutions segment provides apparel labeling solutions to apparel retailers, brand owners, and manufacturers. It has Web-enabled apparel labeling solutions platform and network of 28 service bureaus located in 22 countries that supplies customers with customized apparel tags and labels. The Retail Merchandising Solutions segment offers hand-held label applicators and tags, promotional displays, and queuing systems. The company serves retailers in the supermarket, drug store, hypermarket, and mass merchandiser markets through direct distribution and reseller channels. Checkpoint Systems was founded in 1969 and is based in Thorofare, New Jersey.
Advisors' Opinion:- [By Rich Smith]
Three months after settling upon a new chief executive officer, it looks like Thorofare, N. J.-based Checkpoint Systems (NYSE: CKP ) will soon have itself a new CFO as well.
Best Dividend Companies To Watch For 2014: CNO Financial Group Inc. (CNO)
CNO Financial Group, Inc., through its subsidiaries, engages in the development, marketing, and administration of health insurance, annuity, individual life insurance, and other insurance products for senior and middle-income markets in the United States. The company markets and distributes Medicare supplement insurance, interest-sensitive and traditional life insurance, fixed annuities, and long-term care insurance products; Medicare advantage plans through a distribution arrangement with Humana Inc.; and Medicare Part D prescription drug plans through a distribution and reinsurance arrangement with Coventry Health Care. It also markets and distributes supplemental health, including specified disease, accident, and hospital indemnity insurance products; and life insurance to middle-income consumers at home and the worksite through independent marketing organizations and insurance agencies. In addition, the company markets primarily graded benefit and simplified issue life insurance products directly to customers through television advertising, direct mail, Internet, and telemarketing. It sells its products through career agents, independent producers, direct marketing, and sales managers. CNO Financial Group, Inc. has strategic alliances with Coventry and Humana. The company was formerly known as Conseco, Inc. and changed its name to CNO Financial Group, Inc. in May 2010. CNO Financial Group, Inc. was founded in 1979 and is headquartered in Carmel, Indiana.
Advisors' Opinion:- [By Vanin Aegea]
I have heard many people comment about the insurance policies for cars, houses, life, assets, etc. The arguments always revolve around the same issue: Is it really necessary? What are the chances to be hit by a Hurricane, or to meet a sudden death? Well, nobody really knows. Some individuals however, sleep better when they know a policy backs their life investments. Here, I will look into three insurance companies that concentrate on different policies, or geographies. These are: China Life (LFC), and Conseco (CNO).
Top Growth Stocks To Watch For 2014: Waste Management Inc.(WM)
Waste Management, Inc., through its subsidiaries, provides waste management services to residential, commercial, industrial, and municipal customers in North America. It offers collection, transfer, recycling, and disposal services. The company also owns, develops, and operates waste-to-energy and landfill gas-to-energy facilities in the United States. Its collection services involves in picking up and transporting waste and recyclable materials from where it was generated to a transfer station, material recovery facility, or disposal site; and recycling operations include collection and materials processing, plastics materials recycling, and commodities recycling. In addition, it provides recycling brokerage, which includes managing the marketing of recyclable materials for third parties; and electronic recycling services, such as collection, sorting, and disassembling of discarded computers, communications equipment, and other electronic equipment. Further, the company e ngages in renting and servicing portable restroom facilities to municipalities and commercial customers under the Port-o-Let name; and involves in landfill gas-to-energy operations comprising recovering and processing the methane gas produced naturally by landfills into a renewable energy source, as well as provides street and parking lot sweeping services. Additionally, it offers portable self-storage, fluorescent lamp recycling, and medical waste services for healthcare facilities, pharmacies, and individuals, as well as provides services on behalf of third parties to construct waste facilities. The company was formerly known as USA Waste Services, Inc. and changed its name to Waste Management, Inc. in 1998. Waste Management, Inc. was incorporated in 1987 and is based in Houston, Texas.
Advisors' Opinion:- [By Chris Hill]
Waste Management (NYSE: WM ) reported a slight decline in first-quarter profits but revenues increased. Shares of the trash giant hit their highest point since 1999. In this installment of Motley Fool Money, our analysts talk about the future of Waste Management.
- [By Wallace Witkowski]
Some of the companies most dependent on government for revenue are Harris Corp. (HRS) �with 80% of revenue government-derived; Granite Construction Inc. (GVA) �with 58%; Flir Systems Inc. (FLIR) �with 54%; and Waste Management Inc. (WM) � and Republic Services Inc. (RSG) �both with 50%, according to Goldman Sachs.
- [By Jonas Elmerraji]
Investors think Waste Management (WM) is a garbage stock right now. Why else would WM's short interest ratio hover around 12.6? Of course, Waste Management is in fact a garbage stock of sorts -- it is the largest waste management service provider in the country. The firm boasts more than 270 landfills and a massive fleet of trash collection vehicles that spans the U.S.
When I think garbage firms, the first thing that comes to mind is dividends: WM and its peers historically have generous, recession-resistant dividend payouts. Currently, Waste Management's yield adds up to 3.36% annually. Don't forget, dividends are like kryptonite to short sellers.
WM's willingness to embrace innovation has big potential in the years ahead. Right now, the firm's portfolio includes 22 waste-to-energy plants that are designed to turn the waste that WM literally gets paid to collect into renewable energy that the firm gets paid for again. At this point, the firm's energy plants make up a very small part of its total business, but waste-to-energy projects and the recent acquisition of small oil service firms should look attractive to investors right now.
Earnings in two months look like the next big catalyst for a short squeeze in WM.
- [By Dan Caplinger]
One thing's for sure: You'll never discover truly great investments unless you actively look for them. Let's discuss the ideal qualities of a perfect stock, then decide if Waste Management (NYSE: WM ) fits the bill.
Top Growth Stocks To Watch For 2014: Crocs Inc.(CROX)
Crocs, Inc. and its subsidiaries engage in the design, development, manufacture, marketing, and distribution of footwear, apparel, and accessories for men, women, and children. The company primarily offers casual and athletic shoes, and shoe charms. It also designs and sells a range of footwear and accessories that utilize its proprietary closed cell-resin, called Croslite. The company?s footwear products include boots, sandals, sneakers, mules, and flats. In addition, it provides footwear products for the hospital, restaurant, hotel, and hospitality markets, as well as general foot care and diabetic-needs markets. Further, the company offers leather and ethylene vinyl acetate based footwear, sandals, and printed apparels principally for the beach, adventure, and action sports markets; and accessories comprising snap-on charms. The company sells its products through the United States and international retailers and distributors, as well as directly to end-user consumers th rough its company-operated retail stores, outlets, kiosks, and Web stores primarily under the Crocs Work, Crocs Rx, Jibbitz, Ocean Minded, and YOU by Crocs brand names. As of December 31, 2010, it operated 164 retail kiosks located in malls and other high foot traffic areas; 138 retail stores; 76 outlet stores; and 46 Web stores. Crocs, Inc. operates in the Americas, Europe, and Asia. The company was formerly known as Western Brands, LLC and changed its name to Crocs, Inc. in January 2005. Crocs, Inc. was founded in 1999 and is headquartered in Niwot, Colorado.
Advisors' Opinion:- [By Matt Thalman]
In the following video, Fool contributor Matt Thalman discusses how the company known for its fashion faux pas rubber clog is attempting to change consumers' opinions about what it has to offer. Crocs (NASDAQ: CROX ) is making some big moves, and major strides toward strengthening its offerings and sales. With more than 300 different styles, the company is no longer just the rubber clog with holes in it. And, while that one product still generates more than 47% of the company's revenue, in other countries, it's not seen as such a terrible fashion statement as it is here in the U.S. The company is using that international strength and brand recognition as a way to grow its business.
Top Growth Stocks To Watch For 2014: Intuitive Surgical Inc.(ISRG)
Intuitive Surgical, Inc. designs, manufactures, and markets da Vinci surgical systems for various surgical procedures, including urologic, gynecologic, cardiothoracic, general, and head and neck surgeries. Its da Vinci surgical system consists of a surgeon?s console or consoles, a patient-side cart, a 3-D vision system, and proprietary ?wristed? instruments. The company?s da Vinci surgical system translates the surgeon?s natural hand movements on instrument controls at the console into corresponding micro-movements of instruments positioned inside the patient through small puncture incisions, or ports. It also manufactures a range of EndoWrist instruments, which incorporate wrist joints for natural dexterity for various surgical procedures. Its EndoWrist instruments consist of forceps, scissors, electrocautery, scalpels, and other surgical tools. In addition, it sells various vision and accessory products for use in conjunction with the da Vinci Surgical System as surgical procedures are performed. The company?s accessory products include sterile drapes used to ensure a sterile field during surgery; vision products, such as replacement 3-D stereo endoscopes, camera heads, light guides, and other items. It markets its products through sales representatives in the United States, and through sales representatives and distributors in international markets. The company was founded in 1995 and is headquartered in Sunnyvale, California.
Advisors' Opinion:- [By Brian Pacampara]
Based on the aggregated intelligence of 180,000-plus investors participating in Motley Fool CAPS, the Fool's free investing community, surgical-robot specialist Intuitive Surgical (NASDAQ: ISRG ) has earned a respected four-star ranking.
- [By Dan Caplinger]
The lower a company's profit margin, the greater the impact of the medical-device tax as a proportion of net income. For the highly profitable robotic surgical giant Intuitive Surgical (NASDAQ: ISRG ) , a medical-device tax of 2.3% equates to less than an 8% additional levy on net income from its da Vinci surgical systems using the same assumptions as above, thanks to the company's 30% profit margin. But for Stryker (NYSE: SYK ) , which has a profit margin of about 15%, the medical-device tax is equivalent to a greater than 15% surtax on income from medical devices.
Wednesday, October 30, 2013
Is AT&T Ready to Dial Growth for Investors?
With shares of AT&T (NYSE:T) trading around $37.44, is T an OUTPERFORM, WAIT AND SEE or STAY AWAY? Let's analyze the stock with the relevant sections of our CHEAT SHEET investing framework:
T = Trends for a Stock’s Movement
AT&T is a provider of telecommunications services in the United States and worldwide. Services offered include wireless communications, local exchange services, and long-distance services. AT&T operates in four segments: Wireless, Wireline, Advertising Solutions and Other. The communications products offered through AT&T’s segments reach audiences using just about every widely adopted medium: Internet, voice, television, and mobile. As consumers continue to adopt this technology, giant providers like AT&T stand to see rising profits. Look for AT&T to continue its dominance as consumers and companies aim to communicate quickly, easily, and efficiently.
NEW! Discover a new stock idea each week for less than the cost of 1 trade. CLICK HERE for your Weekly Stock Cheat Sheets NOW!T = Technicals on the Stock Chart are Strong
AT&T stock is in a downtrend that extends back to price highs established in late 1999 and early 2000. The stock has seen a surge higher since the Financial Crisis, however, it is now bumping up against the long-term downtrend. Analyzing the price trend and its strength can be done using key simple moving averages. What are the key moving averages? The 50-day (pink), 100-day (blue), and 200-day (yellow) simple moving averages. As seen in the daily price chart below, AT&T is trading above its rising key averages which signal neutral to bullish price action in the near-term.

(Source: Thinkorswim)
Taking a look at the implied volatility (red) and implied volatility skew levels of AT&T options may help determine if investors are bullish, neutral, or bearish.
| Implied Volatility (IV) | 30-Day IV Percentile | 90-Day IV Percentile | |
| AT&T Options | 14.42% | 10% | 8% |
What does this mean? This means that investors or traders are buying a very low amount of call and put options contracts, as compared to the last 30 and 90 trading days.
| Put IV Skew | Call IV Skew | |
| June Options | Steep | Average |
| July Options | Steep | Average |
As of today, there is an average demand from call buyers or sellers and high demand by put buyers or low demand by put sellers, all neutral to bearish over the next two months. To summarize, investors are buying a very low amount of call and put option contracts and are leaning neutral to bearish over the next two months.
On the next page, let’s take a look at the earnings and revenue growth rates and the conclusion.
E = Earnings Are Mixed Quarter-Over-Quarter
Rising stock prices are often strongly correlated with rising earnings and revenue growth rates. Also, the last four quarterly earnings announcement reactions help gauge investor sentiment on AT&T’s stock. What do the last four quarterly earnings and revenue growth (Y-O-Y) figures for AT&T look like and more importantly, how did the markets like these numbers?
| 2013 Q1 | 2012 Q4 | 2012 Q3 | 2012 Q2 | |
| Earnings Growth (Y-O-Y) | 11.67% | -39.59% | 3.28% | 10% |
| Revenue Growth (Y-O-Y) | -1.46% | 0.23% | -0.06% | 0.25% |
| Earnings Reaction | -5.02% | 0.8% | -0.82% | -2.11% |
AT&T has seen mixed earnings and revenue figures over the last four quarters. From these numbers, the markets have been a little disappointed with AT&T’s recent earnings announcements.
NEW! Discover a new stock idea each week for less than the cost of 1 trade. CLICK HERE for your Weekly Stock Cheat Sheets NOW!P = Poor Relative Performance Versus Peers and Sector
How has AT&T stock done relative to its peers, Verizon (NYSE:VZ), Sprint Nextel (NYSE:S), Comcast (NASDAQ:CMCSA), and sector?
| AT&T | Verizon | Sprint Nextel | Comcast | Sector | |
| Year-to-Date Return | 11.24% | 23.20% | 28.84% | 16.30% | 16.31% |
AT&T has trailed in relative performance, year-to-date.
Conclusion
AT&T provides communications products and services to growing consumers and companies across the nation. The stock has seen a modest run over the last several years but is now bumping up against a long-term downtrend. Earnings and revenue numbers have been mixed which have mostly disappointed investors in the stock. Relative to its peers and sector, AT&T has been a poor year-to-date performer. WAIT AND SEE what AT&T does this coming quarter.
Is Apple a Buy at These Prices?
With shares of Apple (NASDAQ:AAPL) trading around $443, is AAPL an OUTPERFORM, WAIT AND SEE, or STAY AWAY? Let's analyze the stock with the relevant sections of our CHEAT SHEET investing framework:
T = Trends for a Stock’s MovementApple designs, manufactures, and markets mobile communication and media devices, personal computers, and portable digital music players, and a variety of related software, services, peripherals, networking solutions, and third-party digital content and applications. The company's products and services include the iPhone, iPad, Mac, iPod, Apple TV, a portfolio of consumer and professional software applications, the iOS and OS X operating systems, iCloud, and a variety of accessory, service, and support offerings. Apple also delivers digital content and applications through the iTunes Store, App Store, iBook Store, and Mac App Store.
On Tuesday, Apple reported earnings after the bell that beat analyst estimates. On top of that, iPhone sales rose 20 percent, which was higher than expected. However, sales of the iPad fell, as did overall sales in Europe and China, showing that competition is heating up. Apple has been one of the most innovative companies of our time. Its products exist in many homes and companies around the world, and continue to see significant demand domestically and internationally. With rumored upcoming Apple product launches flooding the headlines — namely, the iWatch and new iPhone devices — as well as recently announced products, such as iOS 7, look for Apple to continue to deliver.
T = Technicals on the Stock Chart are MixedApple stock has been on a monster move higher over the last several years. However, the stock has seen a good amount of selling pressure over the last few months. Analyzing the price trend and its strength can be done using key simple moving averages.
What are the key moving averages? They are the 50-day (pink), 100-day (blue), and 200-day (yellow) simple moving averages. As seen in the daily price chart below, Apple is trading between its key averages, which signal neutral price action in the near-term.

(Source: Thinkorswim)
Taking a look at the implied volatility (red) and implied volatility skew levels of Apple options may help determine if investors are bullish, neutral, or bearish.
| Implied Volatility (IV) | 30-Day IV Percentile | 90-Day IV Percentile | |
| Apple Options | 22.69% | 0% | 0% |
What does this mean? This means that investors or traders are buying a very small amount of call and put options contracts, compared to the last 30 and 90 trading days.
| Put IV Skew | Call IV Skew | |
| August Options | Flat | Average |
| September Options | Flat | Average |
As of today, there is average demand from call buyers or sellers, and low demand by put buyers or high demand by put sellers, all neutral to bullish over the next two months. To summarize, investors are buying a very small amount of call and put option contracts, and are leaning neutral to bullish over the next two months.
On the next page, let’s take a look at the earnings and revenue growth rates, and what that means for Apple’s stock.
E = Earnings Are Mixed Quarter-Over-QuarterRising stock prices are often strongly correlated with rising earnings and revenue growth rates. Also, the last four quarterly earnings announcement reactions can help gauge investor sentiment on Apple’s stock. What do the last four quarterly earnings and revenue growth (Y-O-Y) figures for Apple look like, and more importantly, how did the markets like these numbers?
| 2013 Q2 | 2013 Q1 | 2012 Q4 | 2012 Q3 | |
| Earnings Growth (Y-O-Y) | -19.85% | -17.97% | -0.43% | 23.03% |
| Revenue Growth (Y-O-Y) | 0.86% | 11.27% | 17.65% | 27.22% |
| Earnings Reaction | 5.78%* | -0.16% | -12.35% | -0.90% |
Apple has seen mostly decreasing earnings and rising revenue figures over the last four quarters. From these numbers, it seems the markets have had mixed feelings about Apple’s recent earnings announcements.
* As of this writing
P = Weak Relative Performance Versus Peers and SectorHow has Apple stock done relative to its peers, Google (NASDAQ:GOOG), BlackBerry (NASDAQ:BBRY), Microsoft (NASDAQ:MSFT), and sector?
| Apple | | BlackBerry | Microsoft | Sector | |
| Year-to-Date Return | -16.81% | 27.70% | -24.18% | 19.73% | 8.16% |
Apple has been a poor relative performer, year-to-date.
ConclusionApple is an innovative company that has been providing products and services that consumers and companies have been happy to purchase. The rumored products, as well as as the most recent positive earnings report, may generate some buzz for the company. The stock has not done very well in the last few months, but may be stabilizing around current prices. Over the last four quarters, investors in the company have had mixed feelings, as earnings have mostly been decreasing, while revenue has been rising. Relative to its peers and sector, Apple has been a weak year-to-date performer. WAIT AND SEE what Apple does this coming quarter.
Monday, October 28, 2013
Ask Matt: What have been the year’s worst IPOs?
Q: What have been the year's worst IPOs?
A: Potbelly. Noodles & Co. Sprouts Farmers Markets. These are all the huge winning initial public offerings this year. These are the deals most people like to talk about because they've all more than doubled from their IPO prices.
But investors will have a tougher time finding others bragging about buying into IPOs that didn't fare so well this year. And there have been plenty of dogs in what's been a pretty solid year for IPOs.
All three of the worst performing IPOs in 2013 so far have been health care deals, says IPOScoop.com. Propensa Holding, a biotech company working on treatments for diseases including muscular dystrophy, is down more than 66% from the $13 a share offering price. The company disappointed investors in September when saying one of its top drugs in development didn't make it to late-stage clinical trials.
TRACK YOUR STOCKS: Get real-time quotes with our free Portfolio Tracker
Following Propensa is LipoScience, a maker of diagnostics to test patients, which has seen its shares fall 48% from its IPO price of $9 a share. The company told investors in August that demand for its diagnostics test wasn't growing as fast as its costs were. The company lost $2.4 million in the quarter ended in June. And behind LipoScience as the worst IPO of the year is KaloBios, down 48% from its $8 a share IPO price.
These big disappointments in the IPO market are a reminder to investors that making money on unproven stocks isn't as easy as it might seem. Even though the IPO market is raging, and most IPOs are doing well, there are still the laggards.
All Clear For Green Mountain Coffee Roasters?
With shares of Green Mountain Coffee Roasters (NASDAQ:GMCR) trading around $73, is GMCR an OUTPERFORM, WAIT AND SEE or STAY AWAY? Let's analyze the stock with the relevant sections of our CHEAT SHEET investing framework:
T = Trends for a Stock’s Movement
Green Mountain Coffee Roasters is engaged in the specialty coffee and coffee maker businesses. The company roasts Arabica bean coffees, including single-origin, Fair Trade Certified, certified organic, flavored, limited edition and blends offered in K-Cup portion packs, whole bean and ground coffee selections. It also offers other specialty beverages, including tea, hot apple cider and hot cocoa also offered in K-Cup portion packs. The coffee and relative drink trend has been exploding over recent years. Green Mountain Coffee Roasters makes this trend as personal as possible by bringing favorite beverages to the comfort of homes and businesses. As the specialty and related beverage trend operates in full force, look for companies like Green Mountain Coffee Roasters to see rising profits.
NEW! Discover a new stock idea each week for less than the cost of 1 trade. CLICK HERE for your Weekly Stock Cheat Sheets NOW!T = Technicals on the Stock Chart are Strong
Green Mountain Coffee Roasters stock has seen an explosive move higher over the last several years. Just recently however, the stock suffered from negative press that scared a few investors. Today, the stock has recovered and is on path to take out previous all-time highs. Analyzing the price trend and its strength can be done using key simple moving averages. What are the key moving averages? The 50-day (pink), 100-day (blue), and 200-day (yellow) simple moving averages. As seen in the daily price chart below, Green Mountain Coffee Roasters is trading above its rising key averages which signal neutral to bullish price action in the near-term.

(Source: Thinkorswim)
Taking a look at the implied volatility (red) and implied volatility skew levels of Green Mountain Coffee Roasters options may help determine if investors are bullish, neutral, or bearish.
| Implied Volatility (IV) | 30-Day IV Percentile | 90-Day IV Percentile | |
| Green Mountain Coffee Roasters Options | 46.74% | 26% | 25% |
What does this mean? This means that investors or traders are buying a minimal amount of call and put options contracts, as compared to the last 30 and 90 trading days.
| Put IV Skew | Call IV Skew | |
| June Options | Flat | Average |
| July Options | Flat | Average |
As of today, there is an average demand from call buyers or sellers and low demand by put buyers or high demand by put sellers, all neutral to bullish over the next two months. To summarize, investors are buying a minimal amount of call and put option contracts and are leaning neutral to bullish over the next two months.
On the next page, let’s take a look at the earnings and revenue growth rates and the conclusion.
E = Earnings Are Increasing Quarter-Over-Quarter
Rising stock prices are often strongly correlated with rising earnings and revenue growth rates. Also, the last four quarterly earnings announcement reactions help gauge investor sentiment on Green Mountain Coffee Roasters’s stock. What do the last four quarterly earnings and revenue growth (Y-O-Y) figures for Green Mountain Coffee Roasters look like and more importantly, how did the markets like these numbers?
NEW! Discover a new stock idea each week for less than the cost of 1 trade. CLICK HERE for your Weekly Stock Cheat Sheets NOW!| 2013 Q1 | 2012 Q4 | 2012 Q3 | 2012 Q2 | |
| Earnings Growth (Y-O-Y) | 50% | 6.06% | 23.68% | 24.32% |
| Revenue Growth (Y-O-Y) | 13.53% | 15.61% | 32.99% | 21.19% |
| Earnings Reaction | 27.84% | -5.35% | 27.32% | 26.52% |
Green Mountain Coffee Roasters has seen increasing earnings and revenue figures over the last four quarters. From these numbers, the markets have generally been very excited with Green Mountain Coffee Roasters’s recent earnings announcements.
P = Excellent Relative Performance Versus Peers and Sector
How has Green Mountain Coffee Roasters stock done relative to its peers, Starbucks (NASDAQ:SBUX), Dunkin’ Brands (NASDAQ:DNKN), McDonald’s (NYSE:MCD), and sector?
| Green Mountain Coffee Roasters | Starbucks | Dunkin’ Brands | McDonald’s | Sector | |
| Year-to-Date Return | 78.28% | 18.39% | 20.43% | 10.03% | 18.56% |
Green Mountain Coffee Roasters has been a relative performance leader, year-to-date.
Conclusion
Green Mountain Coffee Roasters brings the specialty coffee and related beverage trend home to eager consumers. The stock is now recovering from recent negative press and looks to continue its rip higher. Over the last four quarters, the company has seen rising earnings and revenue figures that have maintained investors excited about the stock. Relative to its peers and sector, Green Mountain Coffee Roasters has been a year-to-date performance leader. Look for Green Mountain Coffee Roasters to OUTPERFORM.
Sunday, October 27, 2013
This Real Estate Opportunity Killed My Business... But It Could Make You 30% Gains
In search of a second income after graduating from college, I started a small real estate publication that worked with local real estate agents to help promote their home listings.
By broad standards, my venture could be labeled a success: On a startup cost of just $20, it had a 15-year run without needing another dime to keep it solvent. Although it certainly didn't make me wealthy, it was self-sustaining and provided me with enough extra cash to drive nice cars and purchase several decent home properties.
Then, the cash cow began to die. I was selling less in marketing and advertising services. By 2005, there wasn't enough money coming in to keep the doors open. The combination of the Internet, the housing bubble, and a consolidation of regional real estate shops had squashed the need for my little company. The market had spoken, and my business was finished.
One of the main catalysts for my company was the fragmented nature of the real estate business: It was mostly mom-and-pop shops with several regional chains mixed into the wide variety of offices dedicated to selling residential real estate.
Other than the often bug-filled and severely lacking multiple listing services, there was no way for real estate agents to differentiate themselves and promote their home listings outside of their company network. My company offered an inexpensive and effective method of intra-real estate office marketing. Other than the Internet, which was slow to catch on with the often middle-age and older real estate agents, consolidation of real estate sales offices hurt my business much more than even the market crash. However, at the same time, this consolidation provides a great way for investors to profit.
Arguably the most successful of these real estate company consolidation firms is Madison, N.J.-based Realogy (NYSE: RLGY).
Given the recent rebound in the real estate market, I think it's an ideal time to invest in this growing company. Realogy is the world's leading franchisor of real estate brokerages. The company's franchise members operate 13,500 offices and employ nearly 250,000 sales associates in more than 100 countries. The company owns household names such as Better Homes and Gardens Real Estate, Century 21 Real Estate, Coldwell Banker, Coldwell Banker Commercial, ERA Real Estate, Sotheby's International Realty and NRT, not to mention related businesses such as relocation service company Cactus Corp. and Title Resource Group, a settlement services and title company.
Realogy posted impressive second-quarter 2013 results with net revenue of more than $1.5 billion representing a 17% increase from the same period last year. Earnings before interest, taxes, depreciation and amortization (EBITDA) was up 27%, to nearly $280 million. In addition, the $330 million retirement of high-cost debt and the $492 million refinancing of 11.5% debt with $500 million of nearly 3.4% debt will continue to help the company's bottom line. Realogy expects year-over-year improvement of 17% to 19% in third-quarter home sale transaction volume.
Considering that real estate firms earn commission from selling other people's property, real estate may be the perfect business: no inventory or commissioned salespeople, but unlimited upside. Combine this potential with the upward swing in the real estate market, and it equals a great opportunity to invest in Realogy.

Risks to Consider: Things are looking positive in the real estate sector. But there is no guarantee the positive trend will continue. The real estate market is tightly tied to the economy as a whole. Any further issues with the macroeconomic picture could negatively affect this stock. Always use stops, diversification and position size wisely when investing.
Action to Take --> Taking a look at the technical picture, the price has been in a choppy channel between $46 and $52 on the daily chart. Buying now in between $46 and $47 should allow you to get in at the bottom part of the current range. My 12-month target is $60. Stops at $42.50 will allow for more potential consolidation prior to the next upswing.
P.S. -- Part of investing is finding little-known stocks like Realogy that offer huge upside... That's why we've recently put together a special report on 17 little-known "spin-off" companies. Because of the way they were formed, these companies have beat the market 7-to-1 in the past decade and raised dividends as much as 600%, yet most investors don't understand them at all. To get the names and tickers of some of these stocks immediately, click here.
Investors wait for Fed, Apple and Facebook
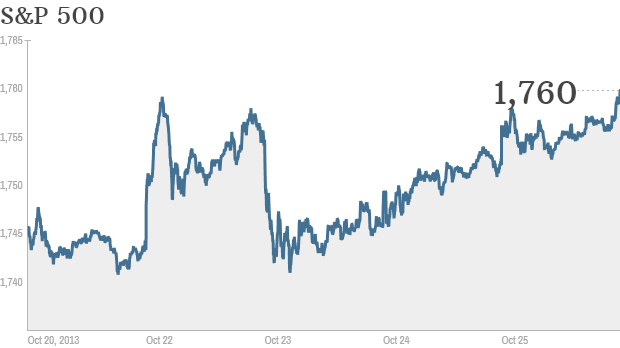
The S&P ended the week on a record high. Click chart for more markets data.
NEW YORK (CNNMoney) Traders will have their eyes on Washington this week -- but not because of a shutdown or debt standoff. They'll be looking to the Federal Reserve.The Fed's policy committee wraps up a two-day meeting on Wednesday. It is highly unlikely to dial back its $85 billion monthly stimulus program that has helped to send stocks soaring this year.
Many investors had expected the Fed to announce it would cut back, or taper, its purchases of bonds and mortgage-backed securities at its meeting last month. But the Fed held off on doing so, saying it wanted more evidence of economic growth.
This month's government shutdown may further muddle the economic picture. So when will the Fed finally start to taper? It's possible Chairman Ben Bernanke, who will be stepping down after his term expires early next year, will leave that decision to his successor. Fed vice chair Janet Yellen has been nominated by President Obama to replace Bernanke. She still needs to be approved by the Senate.
Investors will also be watching earnings this coming week. Results from many big companies that reported last week were mixed. But they were good enough to help lift the Dow, S&P 500 and Nasdaq to weekly gains. The S&P 500 ended the week at a record high.
Yearning for more earnings: Apple (AAPL, Fortune 500) reports its earnings after the closing bell Monday and it could be another weak quarter for the tech giant.
Analysts are expecting profits to fall from a year ago while sales are only expected to rise slightly. The report could shine some light about how the latest iPhones -- the 5S and less expensive 5C -- have sold since their debut last month. Investor Carl Icahn has urged the company to pour its cash into a larger share buyback than the company has planned in order to boost the stock price.
Nokia (NOK), an Apple competitor which recently announced new phones and tablets of its own, reports earnings on Tuesday. Nokia is also in the process of selling its mobile device business to Microsoft (MSFT, Fortune 500).
Herbalife (HLF), the controversial nutritional supplement company that hedge fund manager Bill Ackman is betting against, reports results on Monday. Icahn, who has engaged in a nasty public feud with Ackman, is Herbalife's largest shareholder.
Social media firms LinkedIn (LNKD)! and Facebook (FB, Fortune 500) will report earnings this week as well. Investors will be hoping to see more evidence of mobile growth from Facebook -- especially since Twitter, which is expected to make its market debut in the next few weeks, has disclosed that it is performing extremely well in mobile.
General Motors (GM, Fortune 500) will report earnings on Wednesday. Expectations are high for GM after Big Three rival Ford (F, Fortune 500) reported solid earnings last week.
Starbucks (SBUX, Fortune 500) reports earnings on Thursday. The coffee seller's stock is trading near an all-time high and CEO Howard Schultz has been in the news often due to his views about the dysfunction in Washington.
Sprint (S, Fortune 500) and Exxon Mobil (XOM, Fortune 500) will also be releasing results this week.
No "Jobs Friday" this week: The October jobs report originally scheduled for Friday will come out a week late due to the government shutdown.
But investors will still get a glimpse of what jobs growth was like in October. Payroll processor ADP (ADP, Fortune 500) will release its monthly report on hiring in the private sector. Economists surveyed by Briefing.com expect that 125,000 jobs were added in October, down from 166,000 in September. ![]()
Can Sirius XM Radio Continue to Rise?
With shares of Sirius XM Radio (NASDAQ:SIRI) trading around $4, is SIRI an OUTPERFORM, WAIT AND SEE, or STAY AWAY? Let's analyze the stock with the relevant sections of our CHEAT SHEET investing framework:
T = Trends for a Stock's MovementSirius XM Radio broadcasts its music, sports, entertainment, comedy, talk, news, traffic, and weather channels in the United States on a subscription fee basis through its two satellite radio systems. Subscribers can also receive music and other channels over the Internet, including through applications for mobile devices. Audio entertainment has always pleased consumers and is a medium that is growing in popularity. Sirius XM Radio is looking to expand its audio entertainment channels to every audio medium possible, which will surely translate to rising profits.
Sirius XM Radio reported third-quarter earnings on Thursday morning after the opening bell, giving results and guidance that missed analyst expectations. Sirius's income was $62.89 million, down from $74.5 million a year ago, and although revenue grew 11 percent to $961.5 million, that figure fell short of estimates by over $10 million. Revenue per subscriber was also up to $12.29 from $12.14 last year, but again missed forecasts. Sirius said it expects to make $4 billion in revenue in 2014, a figure below Wall Street expectations.
T = Technicals on the Stock Chart Are StrongSirius XM Radio stock has established higher highs and higher lows in the last few years. The stock is currently trading slightly below highs for the year and looks set to continue. Analyzing the price trend and its strength can be done using key simple moving averages. What are the key moving averages? The 50-day (pink), 100-day (blue), and 200-day (yellow) simple moving averages. As seen in the daily price chart below, Sirius XM Radio is trading above its rising key averages, which signal neutral to bullish price action in the near-term.

(Source: Thinkorswim)
Taking a look at the implied volatility (red) and implied volatility skew levels of Sirius XM Radio options may help determine if investors are bullish, neutral, or bearish.
| Implied Volatility (IV) | 30-Day IV Percentile | 90-Day IV Percentile | |
| Sirius XM Radio Options | 31.54% | 0% | 0% |
What does this mean? This means that investors or traders are buying a very small amount of call and put options contracts as compared to the last 30 and 90 trading days.
| Put IV Skew | Call IV Skew | |
| November Options | Flat | Average |
| December Options | Flat | Average |
As of today, there is an average demand from call buyers or sellers and low demand by put buyers or high demand by put sellers, all neutral to bullish over the next two months. To summarize, investors are buying a very small amount of call and put option contracts and are leaning neutral to bullish over the next two months.
On the next page, let's take a look at the earnings and revenue growth rates and the conclusion.
E = Earnings Are Mixed Quarter-Over-QuarterRising stock prices are often strongly correlated with rising earnings and revenue growth rates. Also, the last four quarterly earnings announcement reactions help gauge investor sentiment on Sirius XM Radio's stock. What do the last four quarterly earnings and revenue growth (Y-O-Y) figures for Sirius XM Radio look like and more importantly, how did the markets like these numbers?
| 2013 Q3 | 2013 Q2 | 2013 Q1 | 2012 Q4 | |
| Earnings Growth (Y-O-Y) | 0.00% | -95.83% | 0.00% | 104.80% |
| Revenue Growth (Y-O-Y) | 11.00% | 12.23% | 11.52% | 13.87% |
| Earnings Reaction | -3.82%* | 2.71% | 5.86% | 1.26% |
Sirius XM Radio has seen mixed earnings and rising revenue figures over the last four quarters. From these numbers, the markets have had conflicting feelings about Sirius XM Radio's recent earnings announcements.
* As of this writing
P = Weak Relative Performance Versus Peers and SectorHow has Sirius XM Radio stock done relative to its peers, Pandora (NYSE:P), CBS (NYSE:CBS), Cumulus Media (NASDAQ:CMLS), and sector?
| Sirius XM Radio | Pandora | CBS | Cumulus Media | Sector | |
| Year-to-Date Return | 36.51% | 191.10% | 56.86% | 115.00% | 98.76% |
Sirius XM Radio has been a poor relative performer, year-to-date.
ConclusionSirius XM Radio provides audio entertainment and information via subscription services to a growing listener base. A recent earnings release has the markets expecting more from the company. The stock has been trending higher in recent years and is currently near highs for the year. Over the last four quarters, earnings have been mixed while revenues have been rising which has produced conflicting feelings among investors. Relative to its peers and sector, Sirius XM Radio has been a weak year-to-date performer. Look for Sirius XM Radio to OUTPERFORM.