October 9, 2014
Tim Cook CEO Apple Inc. 1 Infinite Loop Cupertino, CA 95014
Dear Tim,
As a large Apple shareholder with approximately 53 million shares, we applaud you and the rest of management, especially in light of recent launches and announcements which further validate our view that you are the ideal CEO for Apple. It is truly a watershed moment, with Apple poised to take market share from Google (Android) in the premium device market as iPhone 6 becomes Apple's flagship device among a growing collection of products and services that work together to form an increasingly dominant mobile ecosystem. We believe this advantaged position over Google, the company's only real competitor, justifies our forecasts for revenue and EPS (earnings per share) growth of 25% and 44% respectively for FY (fiscal year) 2015. This strong competitive position and earnings growth compels us to remind you that Apple, adjusting for net cash, currently sells at a P/E (price to earnings per share ratio) of only 8x our FY 2015 forecast, a significantly lower P/E than a broad market index, the S&P 500, which trades today at a P/E of 15x FY 2015 consensus. In contrast to the S&P 500's slower growth, we expect Apple to grow its EPS by 30% in each of FY 2016 and FY 2017. Assuming these growth characteristics for FY 2016 and FY 2017, we see Apple's P/E of just 8x our FY 2015 forecast as both irrational and transient in nature, especially since many actively managed mutual funds remain underweight Apple in their portfolios. Our forecasted growth for FY 2016 and FY 2017 more than adequately justifies using a P/E multiple of 19x our FY 2015 forecast, which along with net cash values Apple at $203 per share today. Described in more detail below, these factors combine to reflect a massive undervaluation of Apple in today's market, which we believe will not last for long. Therefore, given the persistently excessive liquidity of $133 billion net cash on Apple's balance sheet, we ask you to present to the rest of the Board our request for the company to make a tender offer, which would meaningfully a! ccelerate and increase the magnitude of share repurchases. We thank you for being receptive to us the last time we requested an increase in share repurchases, and we thank you in advance now for any influence you may choose to have communicating to the rest of the Board the degree to which a tender offer would have a positive impact on an EPS basis for all shareholders. To preemptively diffuse any cynical criticism that you may encounter with respect to our request, which might claim that we are requesting a tender offer with the intention of tendering our own shares, we hereby commit not to tender any of our shares if the company consummates any form of a tender offer at any price. We commit to this because we believe Apple remains dramatically undervalued. And we think you and the Board agree. If you did not, you would not continue to repurchase shares under the existing authorization. You have said before that the company likes to be "opportunistic" when repurchasing shares and we appreciate that. With this letter we simply hope to express to you that now is a very opportunistic time to do so. We think a tender offer is simply a good method of conducting a large repurchase in an expedited timeframe, but the exact method and the exact size is not the key issue for us. We are simply asking you to help us convince the board to repurchase a lot more, and sooner. We feel compelled to do so because we forecast such impressive earnings growth over the next few years, and therefore we believe Apple is dramatically undervalued in today's market, and the more shares repurchased now, the more each remaining shareholder will benefit from that earnings growth.

Critical to our forecast for strong earnings growth is the belief that the iPhone will take significant premium market share. Given historically high retention rates, we assume existing iPhone users will continue to act like an annuity, choosing to stay with the iPhone each time they upgrade. But now, since the iPhone 6 is the most significant improvement to the iPhone since its introduction, we expect users of competitive products to see the iPhone 6/6+ as an exciting opportunity to choose a superior product. Now that iPhone offers a larger screen size, its price competitiveness in the premium phone market is clear, as a premium Android phone such as the Galaxy S5 and Note 4 sells at a similar price point to the iPhone 6 and 6+ respectively. The choice between them is analogous to the choice between a Volkswagen over a Mercedes at the same price, and unlike a Mercedes, the $649 cost of an iPhone 6 is affordable for the mass market, equating to just $20 per month over a two year period (including a $170 estimated resale value of the phone at the end of two years, excluding financing and taxes). We see the iPhone remaining unaffected by the "junk", as you called it, sold at lower price points, but we also see it dominating the entire class of premium Android smartphones, such as Samsung's Galaxy phones. Because of this, we expect Apple will take premium market share, while at the same time maintaining its prices and gross margins, proving the concept of commoditization is nothing more than a myth with regards to Apple. Beyond simple price comparison, we see the iPhone as best in class, supported by expert reviews and by the lines of people all over the world waiting to buy it. Perhaps most importantly, we believe the iPhone will take market share because its merits are no longer viewed in isolation from the overall Apple ecosystem of products and services, which include iOS, iPad, Mac, Apps, ! App Store, iCloud, iTunes, and (more recently) Apple Watch, Apple Pay, Home, Health, Continuity, Beats. With the iPhone as the foundation, Apple's ecosystem has come to play an important role in the daily life of Apple users, and while Apple continues to make impressive strides to improve it, the competition falls behind in what is arguably the most important race of this technological era. Analogizing Apple to a modern day Secretariat, as this race continues, the further the distance grows between Apple and Google (and Google's hardware partners) in the premium device category. Its leading ecosystem of products and services, added to peerless hardware design and quality, differentiates Apple from a simple hardware company. And, with its users consistently upgrading to the newest version of iOS (92% of iOS devices, iPhones and iPads, on iOS 7 prior to the launch of iOS 8), Apple is able to offer its users the most up to date software and service experience, while Android can't because it's hindered by relatively high fragmentation among its operating system versions. App developers appreciate the difference, which is why they often choose to make an App for iOS prior to (or instead of) Android. During a recent interview, you referred to Google and only Google as your competition, as no other operating system can gain enough scale in Apps to be relevant. Furthermore, you also described how, in contrast to Apple, Google's business model relies on advertising, which will increasingly expose products that run Android to serious privacy concerns. Considering all of this, combined with their inability to merge a superior brand, hardware, software, services, fashion and retail stores, Google and its hardware partners will remain disadvantaged in the premium device market. As this is realized, we expect that Apple will gain market share, that those gains will translate into earnings growth in line with our forecasts, and in turn translate into multiple expansion.
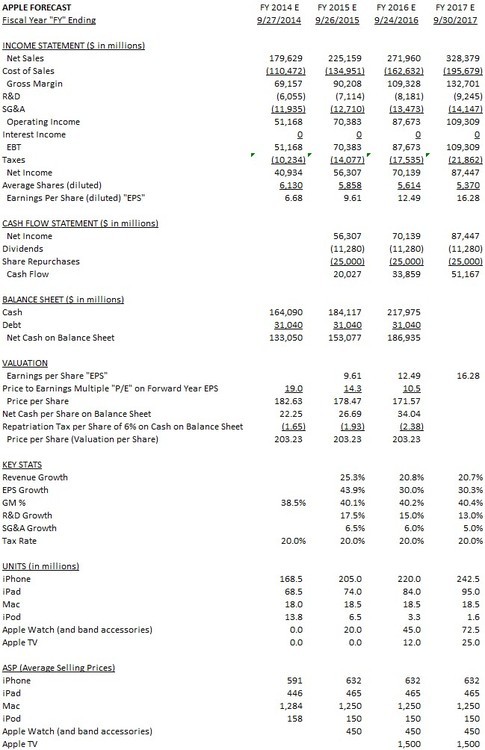
In addition to iPhone 6 market share gains, we assume that earnings growth will be driven by successful innovations and launches of other products and platforms. To properly forecast future earnings for the purposes of valuation, we assume further innovation on existing product lines and services (such as the larger screen iPhone 6 and 6+), but also assume that launches of new product platforms and new services will happen, predict what they might be, and estimate and include the potential earnings from such innovation and launches into forecasted future-year earnings. As our model highlights, much like the success of iPhone and iPad before it, we expect the successful launch of new premium product platforms (the announced Apple Watch in FY 2015 and the rumored TV in FY 2016) along with new services (in particular Apple Pay). These new launches will further distance Apple's ecosystem from its peers and accelerate revenue and earnings growth in excess of the status quo. For the next three fiscal years, we forecast robust earnings growth of 44%, 30%, and 30% respectively, driven by strong revenue growth of 25%, 21%, and 21% respectively. We detail below how we arrive at these forecasts.
iPhone
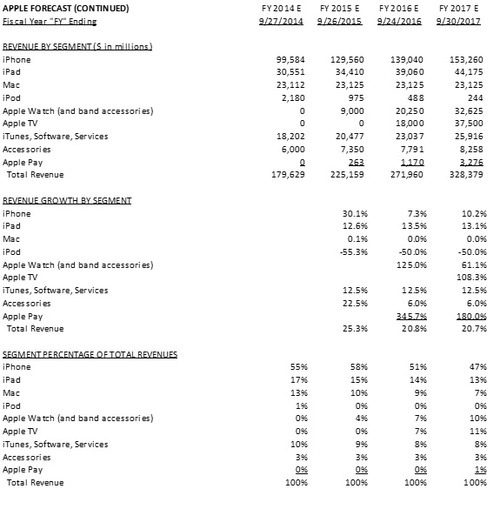
Composing 55% of net sales, iPhone is Apple's largest product platform. Consumers have already responded with unparalleled enthusiasm to the new iPhones with millions of people waiting in lines all around the world to buy an iPhone 6 or 6+, and the positivity from expert reviewers and the press has been stronger than we have ever seen. Legendary reviewer Walt Mossberg simply stated, "This is the best smartphone you can buy, and I am unequivocal about that." Now that Apple is offering larger phones with roughly the same size screen as competitors' offerings, and targeting mainland China at the time of its 4G rollout, we expect Apple to take significant market share. As users roll off their existing wireless carrier contracts, they can choose a superior product at a comparable price. There are obviously lower priced competitive offerings, but the marginal premium one pays for an iPhone is not significant for meaningful percentages of the global population. As we explained earlier in this letter, the effective cost of an iPhone 6 is just $20 per month. Considering the increasing amount of time users spend with their mobile devices, and thereby the practical value of a noticeably superior product, it is hard to imagine why a consumer would choose an inferior phone when the marginal cost difference is so small. That is why we expect Apple to take market share not only from those competitors offering a phone at a similar price, but also those competitors offering phones at cheaper prices. As the quality of the Apple ecosystem (iPhone, iPad, Mac, iTunes, App Store) continues with new additions (Apple Watch, Apple Pay, Home, Health, Continuity, iCloud) to pull away from a relatively flawed and fragmented Android ecosystem, market share gains will continue. For next fiscal year, the new iPhone 6 and 6+ should drive iPhone revenue growth of 30%, due to volume growth of 22% (premium market share gains, category growth, upgrade cycle) and pricing growth of 7% (mix shift to the iPhone 6+ that sells for a $! 100 premium to both the iPhone 6 and the iPhone 5s at this time last year). In the following years, FY 2016 and FY 2017, we expect volume growth of 7% and 10% respectively and flat average selling prices as Apple experiences no pricing pressure and continues to take market share.
iPad and Mac
Contributing 17% to net sales, iPad has experienced tremendous growth since its introduction in 2010. After a disappointing FY 2014, we believe the iPad will reaccelerate growth next year, especially if Apple, as rumored, offers a larger screen 12.9" iPad in FY 2015 and improves the offering of its 7.9" iPad Mini and its 9.7" iPad Air. We believe there is still a large growth opportunity for iPad, as you highlighted when you stated that "the PC market today is 315 million units" and "despite the iPad's 76% market share of tablets sold to businesses, the penetration of tablets in businesses is low at 20% and, to put that in some kind of context, if you looked at the penetration of notebooks in business it would be over 60%." With the recently announced partnership with IBM, which you suggested will "change how businesses work", we believe iPad will increase its penetration of enterprise. For next fiscal year, the new iPad innovation and IBM partnership should drive iPad revenue growth of 13%, due to volume growth of 8% (innovation, larger iPad, IBM partnership) and pricing growth of 4% (mix shift to the rumored higher priced iPad). In each of the following years, FY 2016 and FY 2017, we expect revenue growth of 13% on relatively flat average selling prices as the ecosystem and IBM partnership continue to drive sales. Contributing 13% to net sales, Mac in contrast to the overall PC market, has grown market share to maintain its volume and sales. We expect Mac to continue this steady performance going forward and hold net sales flat over the next three years. While we are not yet prepared to make near term adjustments to raise our forecasts for the next three years, we do believe Apple may be able to innovate even further across the iPad/Mac platforms. Some see a larger iPad as a necessity if Apple is going to transform iOS into a hybrid desktop/tablet operating system by adding a keyboard/mouse centric user interface to iOS, while at the same time maintaining its touch-friendly user ! interface. With a near 13" model, Apple would have a screen size lineup that overlaps their Macbook Air line, a promising path into the $63 billion sub $1,000 laptop market in which Apple barely participates today, according to Rod Hall at JP Morgan.
iTunes, Software and Services, Accessories, and iPod
These three segments, contributing 10%, 3% and 1% to net sales respectively, fill out the remaining portion of Apple's current net sales mix. iTunes, Software and Services are not only important to Apple's ecosystem in terms of driving sales of its products, but also in terms of its own long term revenue growth. This represents one of Apple's faster growing segments and one we expect to not only continue its double digit top line growth but also to disproportionately benefit gross margins as higher margin services (such as 100% margin App Store sales revenues) compose a greater portion of the sales. As for Accessories and iPod, we expect the impact of the acquisition of Beats and accessory growth moving forward to more than offset the continued decline of iPod, which is already relatively immaterial to net sales.
Apple Watch
Over the next three years, we expect the Apple Watch to have a significant impact on Apple's growth. Apple's first new product category since the iPad in 2010, and the company's first foray into wearables, the Apple Watch will launch early next calendar year. It appears to us that Jony Ive and his team have yet again executed at a level that will bring to market a product that revolutionizes the entire category from both a hardware and software perspective, especially given that Apple has developed an entirely new operating system for this device, and catered to the notion that such a device needs to be far more fashionable and personal than other products currently available in this category. As an accessory to the iPhone (model 5 or thereafter), we believe we have included in our forecast sales for the Apple Watch that imply a reasonable attach rate to the iPhone, with unit sales volume resembling that of the iPad in scale, and ramping at a similar incline, selling 20 million units in FY 2015, 45 million units in FY 2016, 72.5 million units in 2017. Although the sales mix between collections, the attach rate of bands to each watch, and the related prices remain unknown, we expect the average selling price to exceed the entry level price of $350, forecasting an average selling price of $450 per unit, including the extra band.
UltraHD Television
While Apple has not announced plans for a TV set and may never do so, we believe we have good enough reason to expect the introduction of an UltraHD TV set in FY 2016. We think television represents a large opportunity for Apple, one that reaches far beyond "the hobby" that Apple TV currently represents. You recently stated, "TV is an area of great interest for Apple" and we agree that it should be. As we highlighted in our previous letter, we believe UltraHD's (ultra-high-definition television) superior picture quality in comparison to regular HD will drive a major TV replacement cycle as the price gap between them narrows. It should also be noted that Reed Hastings, CEO of Netflix, has referenced UltraHD as a major catalyst for Netflix going forward, and while this is true for Netflix, we believe it is also true for Apple. Against the backdrop of this replacement cycle, FY 2016 represents an opportune time to introduce an UltraHD TV set. Therefore, included in our forecasts, we expect Apple to sell 12 million 55" and 65" TV sets in FY 2016 and 25 million in FY 2017 at an average selling price of $1,500 at gross margins consistent with the overall company. While we think adding a TV set to the Apple ecosystem would be meaningful from a financial perspective, we understand that you may choose not to do so, as you have wisely stated that "the toughest choices for Apple are what not to work on." But, even if Apple chooses not to offer a TV set, our earnings estimates would only be revised for FY 2016 and FY 2017, and the impact is not significant enough for us to question using a P/E multiple of 19x our FY 2015 EPS for Apple today, especially since, even without a TV set, our forecast shows EPS growth of 19% in FY 2016 and 23% in FY 2017. While the UltraHD replacement cycle alone offers a compelling revenue opportunity, the opportunity is not limited to the sales of an UltraHD TV. Televisions are a centerpiece to the modern living room and thereby a promising gateway into the home for ! Apple's growing ecosystem. Apple could sell UltraHD movies and shows through iTunes over the internet to the UltraHD TV since cable companies will likely be slow to upgrade their expensive linear infrastructure, as one example of an incremental opportunity. Another is the user interface of television, which you humorously (but accurately, in our opinion) described as being "stuck in the 1970s."
HomeKit and HealthKit
But like so many of Apple's opportunities, an UltraHD TV is just one possible point of entry to a much broader overall opportunity, as the living room is just one room in the home and Apple's growing ecosystem makes the entire home an approachable venue. For example, Apple's recently released HomeKit, a framework in iOS 8 for communicating with and controlling connected accessories in a user's home from the iPhone and Apple Watch. The point here is, when considering the overall ecosystem, the iPhone and the Apple Watch become control devices for both the television in the living room, as well as the lights in the living room and throughout the entire house, and the lock for the front door, the thermostat, the alarm system, etc. You said publicly that you enjoy using your Apple Watch as a remote control for your TV, and we look forward to joining you. But we also assume you will soon enjoy using your Apple Watch to control many more devices in your home. The recently released HealthKit platform represents another similarly large opportunity, and while the details of the business model are still unclear, just as they are for the home category, the degree to which both could impact their respective venues is immense. At a minimum, these new efforts in Health and Home will strengthen the Apple ecosystem and drive product sales of the Apple Watch and iPhone. Though it is likely Apple will monetize HomeKit and HealthKit in some way going forward, we have not included any revenues from these emerging platforms in our forecast for the next three years.
Apple Pay
As the home represents one compelling category for Apple, payments represents another. Apple Pay will launch in October 2014, and while we expect limited financial impact in FY 2015 as retailers upgrade their infrastructure to incorporate the requisite near-field communications technology (NFC), we expect a more meaningful contribution in FY 2016 that accelerates into FY 2017 and the following years. We estimate that, based upon Apple Pay's rumored fee of 15 bps of all spend on credit and debit cards (U.S. card spend was $4.2 trillion in 2012) and merchant deployment of NFC reaching 80%+ in 2017, Apple in the U.S. could generate revenues (also equivalent to gross margins, as the variable costs are de minimis) of $2.5 billion in FY 2017 if it reaches 30% market share of all spend on U.S. credit and debit cards. The potential in the U.S. and internationally over a longer term is much larger. Apple, dominant in the premium market, has customers who spend more on average than its peers, and it is therefore unusually well positioned to succeed with Apple Pay where others could not.
Conclusion
To be totally clear, this letter is in no way intended as a criticism of you as CEO, nor is it intended to be critical of anything you or your team are doing from an operational perspective at Apple. Quite to the contrary, we could not be more supportive of you and your team, and of the excellent work being done at Apple, a company that continues to change the world through technological innovation. The intention of this letter is to communicate two things to you: (1) given the earnings growth we forecast for Apple, we continue to think that the market misunderstands and dramatically undervalues Apple and (2) the excess liquidity the company continues to hold on its balance sheet affords the company an amazing opportunity to take further advantage of this valuation disconnect by accelerating share repurchases. As mentioned before, we thank you and the Board for being receptive to us when we last communicated our perspective regarding the company's valuation and requested more share repurchases. It is our understanding that you solicited feedback from various large shareholders concerning our previous request, but we don't think anyone would deny that we were a key influence with respect to your previous decision to increase share repurchases. We thank you for being receptive to us and other large shareholders, all of whom are investment professionals offering advice concerning an investment decision, as the decision to repurchase shares is in effect the company making an investment in itself. And given the size of our investment and our proven track record with respect to public equity investing, we hope you will be receptive once again. Between January 1, 2000 through September 30, 2014, an investment in the stock of Icahn Enterprises L.P. (NASDAQ: IEP) had an annualized gross return of 21.5%. The Sargon Portfolio (a designated portfolio of assets co-managed by Brett Icahn and David Schechter within the private investment funds comprising Icahn Enterprises' Investment segment, subject to the su! pervision and control of Carl Icahn (Trades, Portfolio)) has generated annualized gross returns of 36.5% since its formation on April 1, 2010 through September 30, 2014 with $6.6 billion of assets under management as of September 30, 2014. We believe this performance speaks for itself with respect to our expertise. At today's price, Apple is one of the best investments we have ever seen from a risk reward perspective, and the size of our position is a testament to this. This investment represents the largest position in our investment history, reflecting the strength of the convictions we have expressed in this letter. While we recognize and applaud the company's previously increased share repurchase authorization, we ask you to consider our advice once again (to the benefit of all shareholders) and consider accelerating share repurchases again via a tender offer. Our valuation analysis tells us that Apple should trade at $203 per share today, and we believe the disconnect between that price and today's price reflects an undervaluation anomaly that will soon disappear. Mutual funds today face fierce competition with index funds that simply match the S&P500 index (in which Apple has a weight of 3.4%). Surprisingly, many mutual funds are underweight Apple, meaning that Apple represents less than 3.4% of their overall portfolio. This also means they are more likely to underperform the index if Apple outperforms, which is obviously an eventuality that should concern them. With more and more funds flowing from mutual funds to index funds (because mutual funds have consistently failed to outperform) the last thing they will want to see is their underperformance exacerbated by remaining underweight Apple as it continues to outperform. As the strength of the earnings growth we forecast materializes, and these funds scramble to correct this mistake, only to find themselves competing in the market to do so, a de facto short squeeze may occur, and we can only hope that the company has repurchased all the! shares i! t can before that happens.
Sincerely,
Carl C. Icahn Brett Icahn David Schechter
REMAINING KEY ASSUMPTIONS
Gross Margins - higher average selling prices, scale, higher margin new services such as Apple Pay, and our expectation that new product platforms (Apple Watch, TV) will have margins consistent with the overall company, together support gross margins rising from 38.5% in FY 2014 to 40% in FY 2015, and remain at 40% for both FY 2016 and FY 2017.
Research & Development "R&D" - we expect continued heavy investment in R&D, rising 17.5%, 15%, and 13% over the next three years to $9.2 billion in FY 2017 (up from $1.8 billion spent in FY 2010) as Apple continues to innovate aggressively.
Selling, General, & Administrative "SG&A" – we expect continued investment in SG&A, as it rises by 6.5%, 6%, and 5% over the next three fiscal years.
Interest Income - with regards to interest income, since we value the net cash separately from the business, we assume no interest income from the $133 billion of net cash in our earnings forecast.
Effective Tax Rate – importantly for the company's income tax rate, we consider 20% a more appropriate tax rate for the purposes of forecasting real earnings, not the 26% effective tax rate Apple uses in their income statement. Most companies in the S&P 500 state that they plan to permanently reinvest its international earnings and therefore do not have to accrue for an income tax on unremitted earnings and thus show a lower tax rate. Google is a good example of this, as its effective tax rate is 20%. Apple, unlike Google and most companies in the S&P 500 has chosen to accrue income taxes on some of its unremitted international earnings and accordingly has an effective tax rate of 26%. Therefore, when assessing the multiple of earnings at which Apple should trade, we believe it is appropriate to use a 20% tax rate for Apple in order to make such comparisons Apples to Apples, no pun intended.
Share Repurchases - we assume Apple continues to repurchase $25 billion of stock per year for our forecast and not the more aggressive pace we hope this Board will undertake
Cash Flow - for simplicity purposes, we assume net income equals cash flow other than dividends and share repurchases.
Valuation - with regards to valuation of the company at $203 per share, this includes valuing the business $192 per share (at 19x our FY 2015 earnings estimate of $9.61 per share) plus net cash per share of $21 ($133 billion of net cash less the tax effect on international cash for repatriation, which we estimate to ultimately be 6%, and for simplicity purposes, apply to all cash on balance sheet rather than just the international cash).
About the author:Canadian Valuehttp://valueinvestorcanada.blogspot.com/


 Royals catcher Salvador Perez celebrates with fans after the team won the pennant. Kansas City fans will pay more than $1,000 on average to watch the team in the World Series. NEW YORK (CNNMoney) Kansas City Royals fans, eager to watch their team play in the World Series for the first time in 29 years, are paying top dollar for the first two games of the Series.