Last Thursday, Amazon (AMZN) announced its fiscal first quarter results. The company missed analyst estimates for revenues, but beat on the bottom line. Second quarter guidance was disappointing, which has become a trend for the online retailer. On Friday, Amazon shares dropped by more than 7 percent. For many, Amazon's lack of profits has led to a sky high valuation, and the shorts are quick to throw out that fact. However, Amazon shares for the most part do not stay down long, as I've been telling you how many trade this company more on price to sales than price to earnings. Today, I'll break down the results, and discuss whether the recent fall is a sign of things to come.
First Quarter results:
For the quarter, Amazon reported total revenues of $16.07 billion. This number missed analyst estimates for $16.16 billion. Don't forget, analysts had cut their estimates going into this report. When Amazon reported Q4 results, Amazon guided to revenues of $15.0 to $16.6 billion, and analysts were looking for $16.86 billion. So analysts took down their average estimate by $700 million, and Amazon still missed.
Amazon does not provide earnings per share guidance, but they do provide operating income guidance. Amazon guided from an operating loss of $285 million to an operating profit of $65 million. They came in at an operating profit of $181 million, well above the high end of their guidance range. On the bottom line, Amazon earned $0.18, which beat analyst expectations for $0.09. While this beat seems impressive at twice what analysts were expecting, analysts were expecting $0.34 when Amazon reported Q4. Thus, Amazon analysts took down their numbers, and Amazon beat. Given how small their profit margins are, it does not take much to beat on the bottom line.
Margin analysis:
The table below shows Amazon's Q1 margins against the year ago period numbers. I'll use these numbers to further break down the results. For simplicity, I'm calculating Amazon's gross profit (and ! thus gross margins) as revenues minus cost of revenues. Although you may see other ways to calculate Amazon's gross margins, this is the way that most analysts do it.
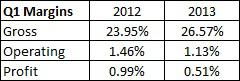
Amazon actually reported a 261 basis point increase in gross margins. This is because the company's revenues were up 21.88% in the period, but the cost of revenues only rose by 17.69%. Amazon's gross profit rose by 35.18% over the year ago period, which is why you see the tremendous jump in gross margins.
But on the operating side, things got much worse. Fulfillment expenses, Amazon's largest operating expense (below gross profit) rose by 38.69%, and marketing expenses rose by 31.67%. Technology and content expenses rose by 46.35%, and general and administrative expenses rose by 23.00%. Other income also declined a little. Overall, Amazon's total operating expenses rose by 37.83% over the year ago period. That's why, despite a 261 basis point rise in gross margins, Amazon's operating margins declined by 33 basis points. Operating income for the period was down 5.73%.
Amazon also saw a decline in interest income, while interest expenses were up 57% over the year ago period. Amazon recouped some of these losses since other expenses improved a bit. Amazon's net income plunged from $130 million to $82 million for the period. Remember, last year's Q1 period was significantly helped by an $89 million gain in equity-method investment activity, net of tax. This year's period saw a $17 million loss. Overall, Amazon's net income dropped by 37%, and you can see that in the net profit margins above.
Even though Amazon reported a profit for the quarter, the company's trailing twelve month margins actually got worse. That is because, as I said above, net income was a bit higher in Q1 last year thanks to the investment gain. Amazon's trailing twelve month operating margins are not at a new low, b! ut traili! ng twelve month net profit margins are. The chart below shows those numbers over the past couple of years.
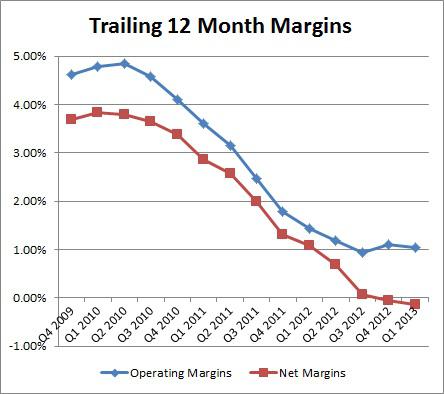
The bottom line margins could start to improve over the next quarter, depending on how Amazon does. The company had a small $7 million profit in Q2 last year, so anything above that would improve the trailing twelve month numbers. Amazon also had a big Q3 loss, so if they just don't lose as much in that quarter this year, they could see trailing margins improve. However, it is extremely funny to see a company quickly improve revenues, while profits go in the other direction. In Q1 of 2010, Amazon's net profit margin was just under 4.20%, and in this year's period, it was just over 0.50%.
Second quarter guidance:
Amazon's guidance has disappointed in recent quarters, and it did again this time. For fiscal Q2, Amazon guided to revenues in a range of $14.5 billion to $16.2 billion. The midpoint of that guidance is $15.35 billion, well below the $15.94 billion analysts were looking for. The midpoint of that guidance implies 19.5% year over year growth, under a key 20% level that investors are watching. Amazon's growth is slowing down, and the 20% level will be a key one to watch.
Like I mentioned above, Amazon does not provide earnings per share guidance. They provide operating income guidance. Amazon guided in a range from an operating loss of $340 million to an operating profit of $10 million. The midpoint of that range would be an operating loss of $165 million, well below the $107 million operating profit in the prior year period. Amazon has done well in terms of operating income guidance lately, but that's not exactly hard to do.
Amazon's balance sheet:
Since Amazon is not very profitable and they continue to spend, spend, spend, their balance sheet has been getting a bit weaker in the past few years. Because they are a retaile! r and bus! iness can be very seasonal, it's usually useless to compare the balance sheet from one quarter to the next (Q4 to Q1). The best way to compare things are year to year, or do what I do, which is use a 4-quarter rolling average (the average of the last four quarters reported).
Amazon's cash and short-term investments pile has increased over last year's period, thanks to the $3 billion in debt they raised late last year. That has also increased the amount of working capital over Q1 last year, although the current ratio has decreased slightly. One item I like to look at is the debt (liabilities to assets) ratio. The chart below shows that ratio on a 4-quarter rolling basis.
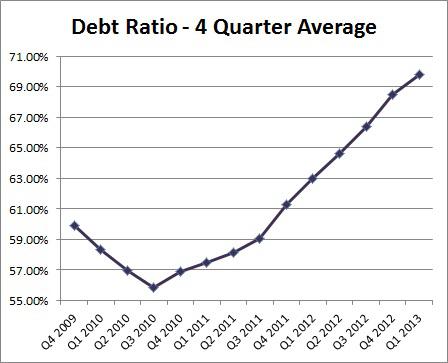
Since Q3 of 2010 (which includes the 4 quarters between Q4 '09 and Q3 '10), Amazon's rolling debt ratio has gone from 55.87% to 69.77%. As you saw in the chart above, the rolling average is rising every single quarter. Amazon is not in any financial trouble currently, but they might want to get this ratio under control at some point.
Valuation using price to sales:
Because Amazon doesn't really have any earnings per share, using a price to earnings valuation doesn't really work. This is especially true because as Amazon's net income has fallen, the stock has gone higher and higher. I've been arguing that the street is really looking at the price to sales ratio, and that's the best explanation for now. The market cap keeps going up because of rising sales.
After last quarter's report, Amazon was trading at just over 2 times trailing twelve month sales. Based on some historical numbers, and the fact that growth was slowing down, I argued that using even 1.8 times price to sales got you to $298 a share if Amazon produced $75 billion in revenues during 2013. After Friday's fall, Amazon is trading at 1.81 times trailing twelve month revenues. That 1.8 times sales figure is look! ing rough! ly in-line right now. However, if Amazon continues to disappoint on the revenue front, I think this valuation should be taken down to 1.7 times sales. If Amazon disappoints, $74 billion for revenues this year could be appropriate, as current estimates call for $75.42 billion. At 1.7 times sales and a $74 billion revenue clip, Amazon would be worth about $276.
That is basically where we were at going into Friday. Yes, I know this is a lot of hypothetical numbers, but Amazon's valuation has been a mystery to some for quite a while now. This is the best way I think you can analyze it. However, one must also take into account the falling margins and weakening balance sheet. If Amazon continues to see falling margins and a rising debt ratio, you might have to discount that a bit. It's amazing that Amazon can keep disappointing on so many fronts and the stock holds up, while Apple (AAPL) actually has profits, a dividend, and a buyback, and the stock plummets. Eventually, Amazon could plummet too.
Beefing up the content wars:
Amazon has continued to invest in content as it tries to rival Netflix (NFLX). In the two plus years since Amazon launched Prime Instant Video, Amazon has boosted its content library from about 5,000 titles to over 38,000 titles. You can see the growth in Prime's library in the chart below.
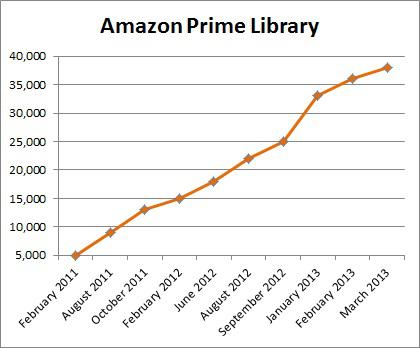
Amazon still remains well behind Netflix though. Netflix just announced a huge first quarter, bringing in plenty of new subscribers thanks to their hit original show "House of Cards". Netflix has launched a second original since then, and has new episodes of "Arrested Development" coming in late May. Amazon is also launching their own original content, but Amazon is targeting mostly comedies, and cheaper shows. Amazon is looking to spend about $1 million per episode, while some of Netflix's originals cost $3 million, $4 million, or more, per e! pisode. O! f the "Top 200" shows watched on Netflix during Q1 (top 100 movies and 100 TV shows), Amazon had just 74 of those titles. Amazon will continue to spend to rival Netflix, but it remains to be seem how successful they are. Since Amazon doesn't release prime subscriber numbers or financial results, we may never know. However, many speculate that Amazon is losing a fair amount of money on Prime, and since Netflix is barely making money with a lot more subscribers, it definitely is possible.
Final Thoughts - short on pops:
Amazon's stock has done rather well in recent years, despite net income levels falling and revenue growth not meeting expectations. Amazon missed revenue estimates in Q1, and issued lower than expected guidance again. Even though Amazon beat on the bottom line, Amazon's weak guidance will likely cause analysts to reduce their earnings estimates going forward. It seems highly unlikely that Amazon will earn $1.44 this year.
So what's the trade? Well, because this stock is so tough, I think it stays flat or goes higher from here. However, I think you can short on the next pop, probably one to around $275 or $280. As you can see from the chart below, Amazon has met some resistance at that area. If Amazon continues to miss estimates and guide lower, it is likely that eventually this stock will continue falling. Even the price to sales argument won't work then.
(click to enlarge)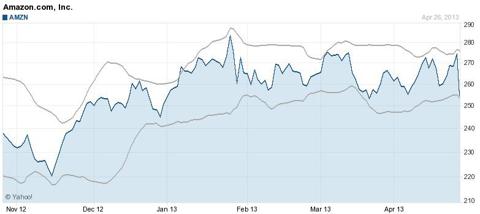
(Source: Yahoo! Finance)
Disclosure: I have no positions in any stocks mentioned, but may initiate a long position in AAPL over the next 72 hours. I wrote this article myself, and it expresses my own opinions. I am not receiving compensation for it (other than from Seeking Alpha). I have no business relationship with any company whose stock is mentioned in this article. (More...)
Additional disclosure: Investors are always reminded that before making any investment, you should do your own proper due diligence on any name directly or indirectly mentioned in this article. Investors should also consider seeking advice from a broker or financial adviser before making any investment decisions. Any material in this article should be considered general information, and not relied on as a formal investment recommendation.
No comments:
Post a Comment